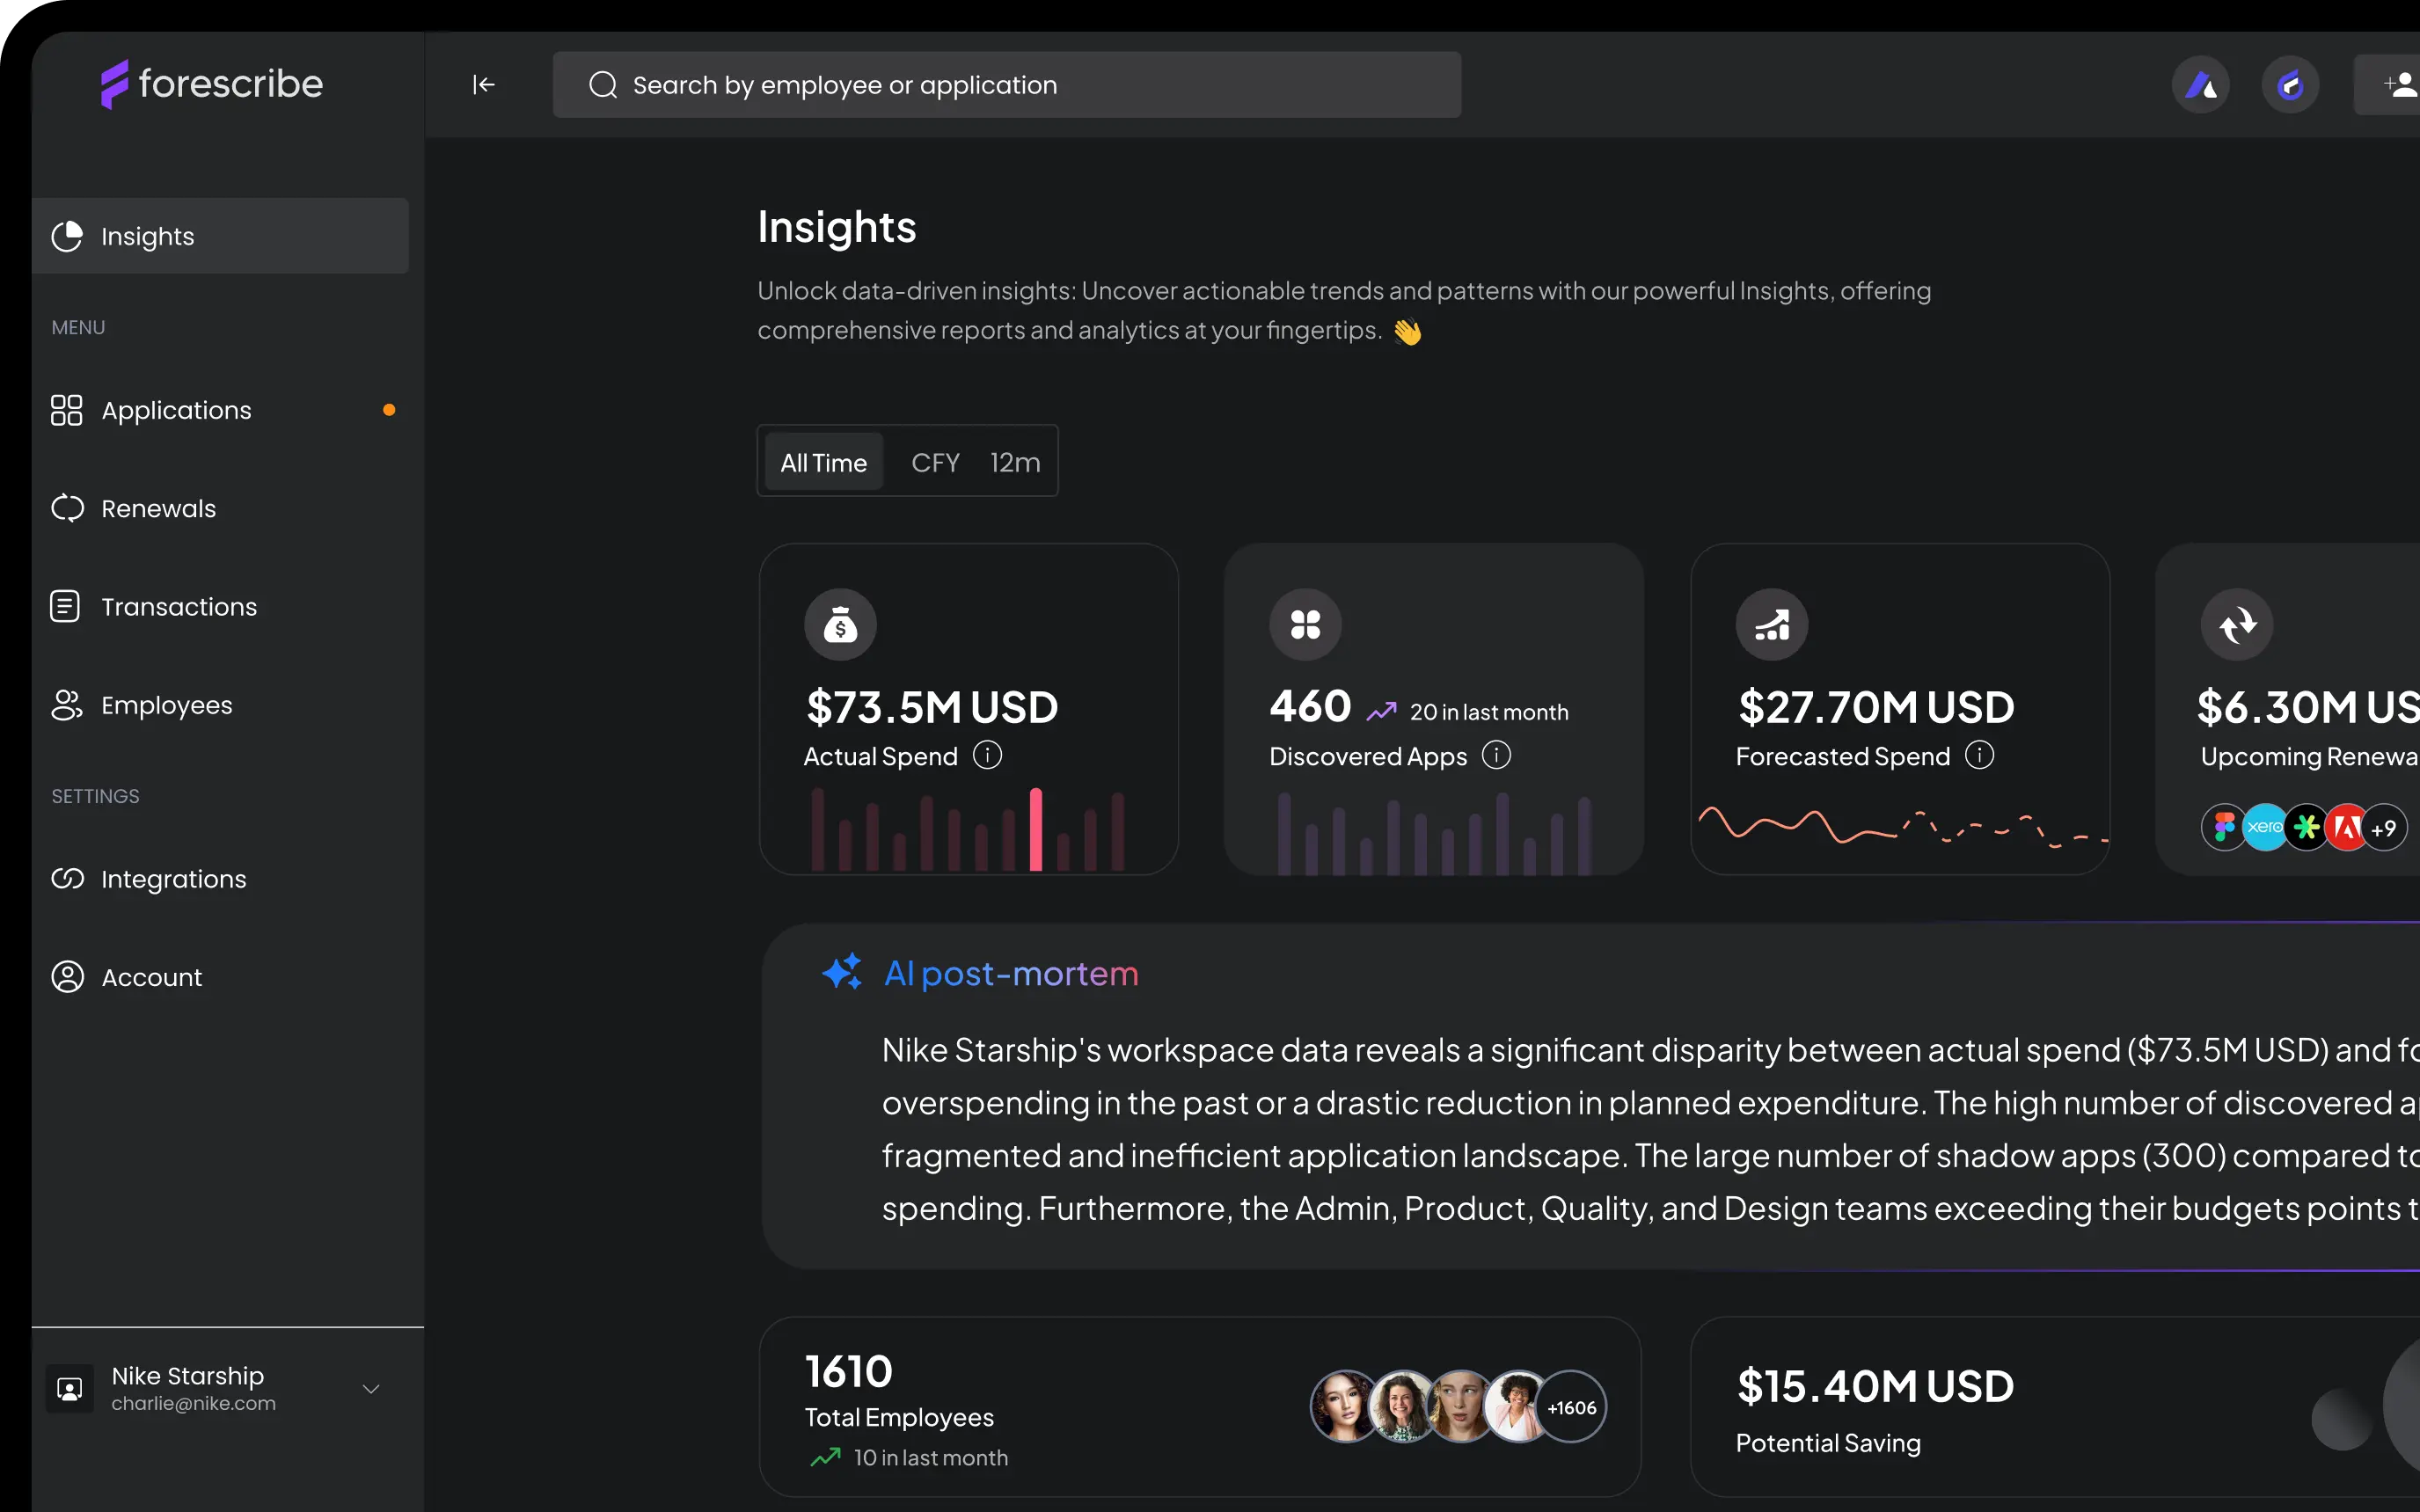
What is License Utilization Graph?
A visual chart displaying the percentage of licenses actively used versus those unutilized across time.
Why it Matters
Helps stakeholders make data-driven decisions about renewals, upgrades, and downgrades.
Benefits
- Time-based usage trends
- Visual license insights
- Granular filtering by app or role


