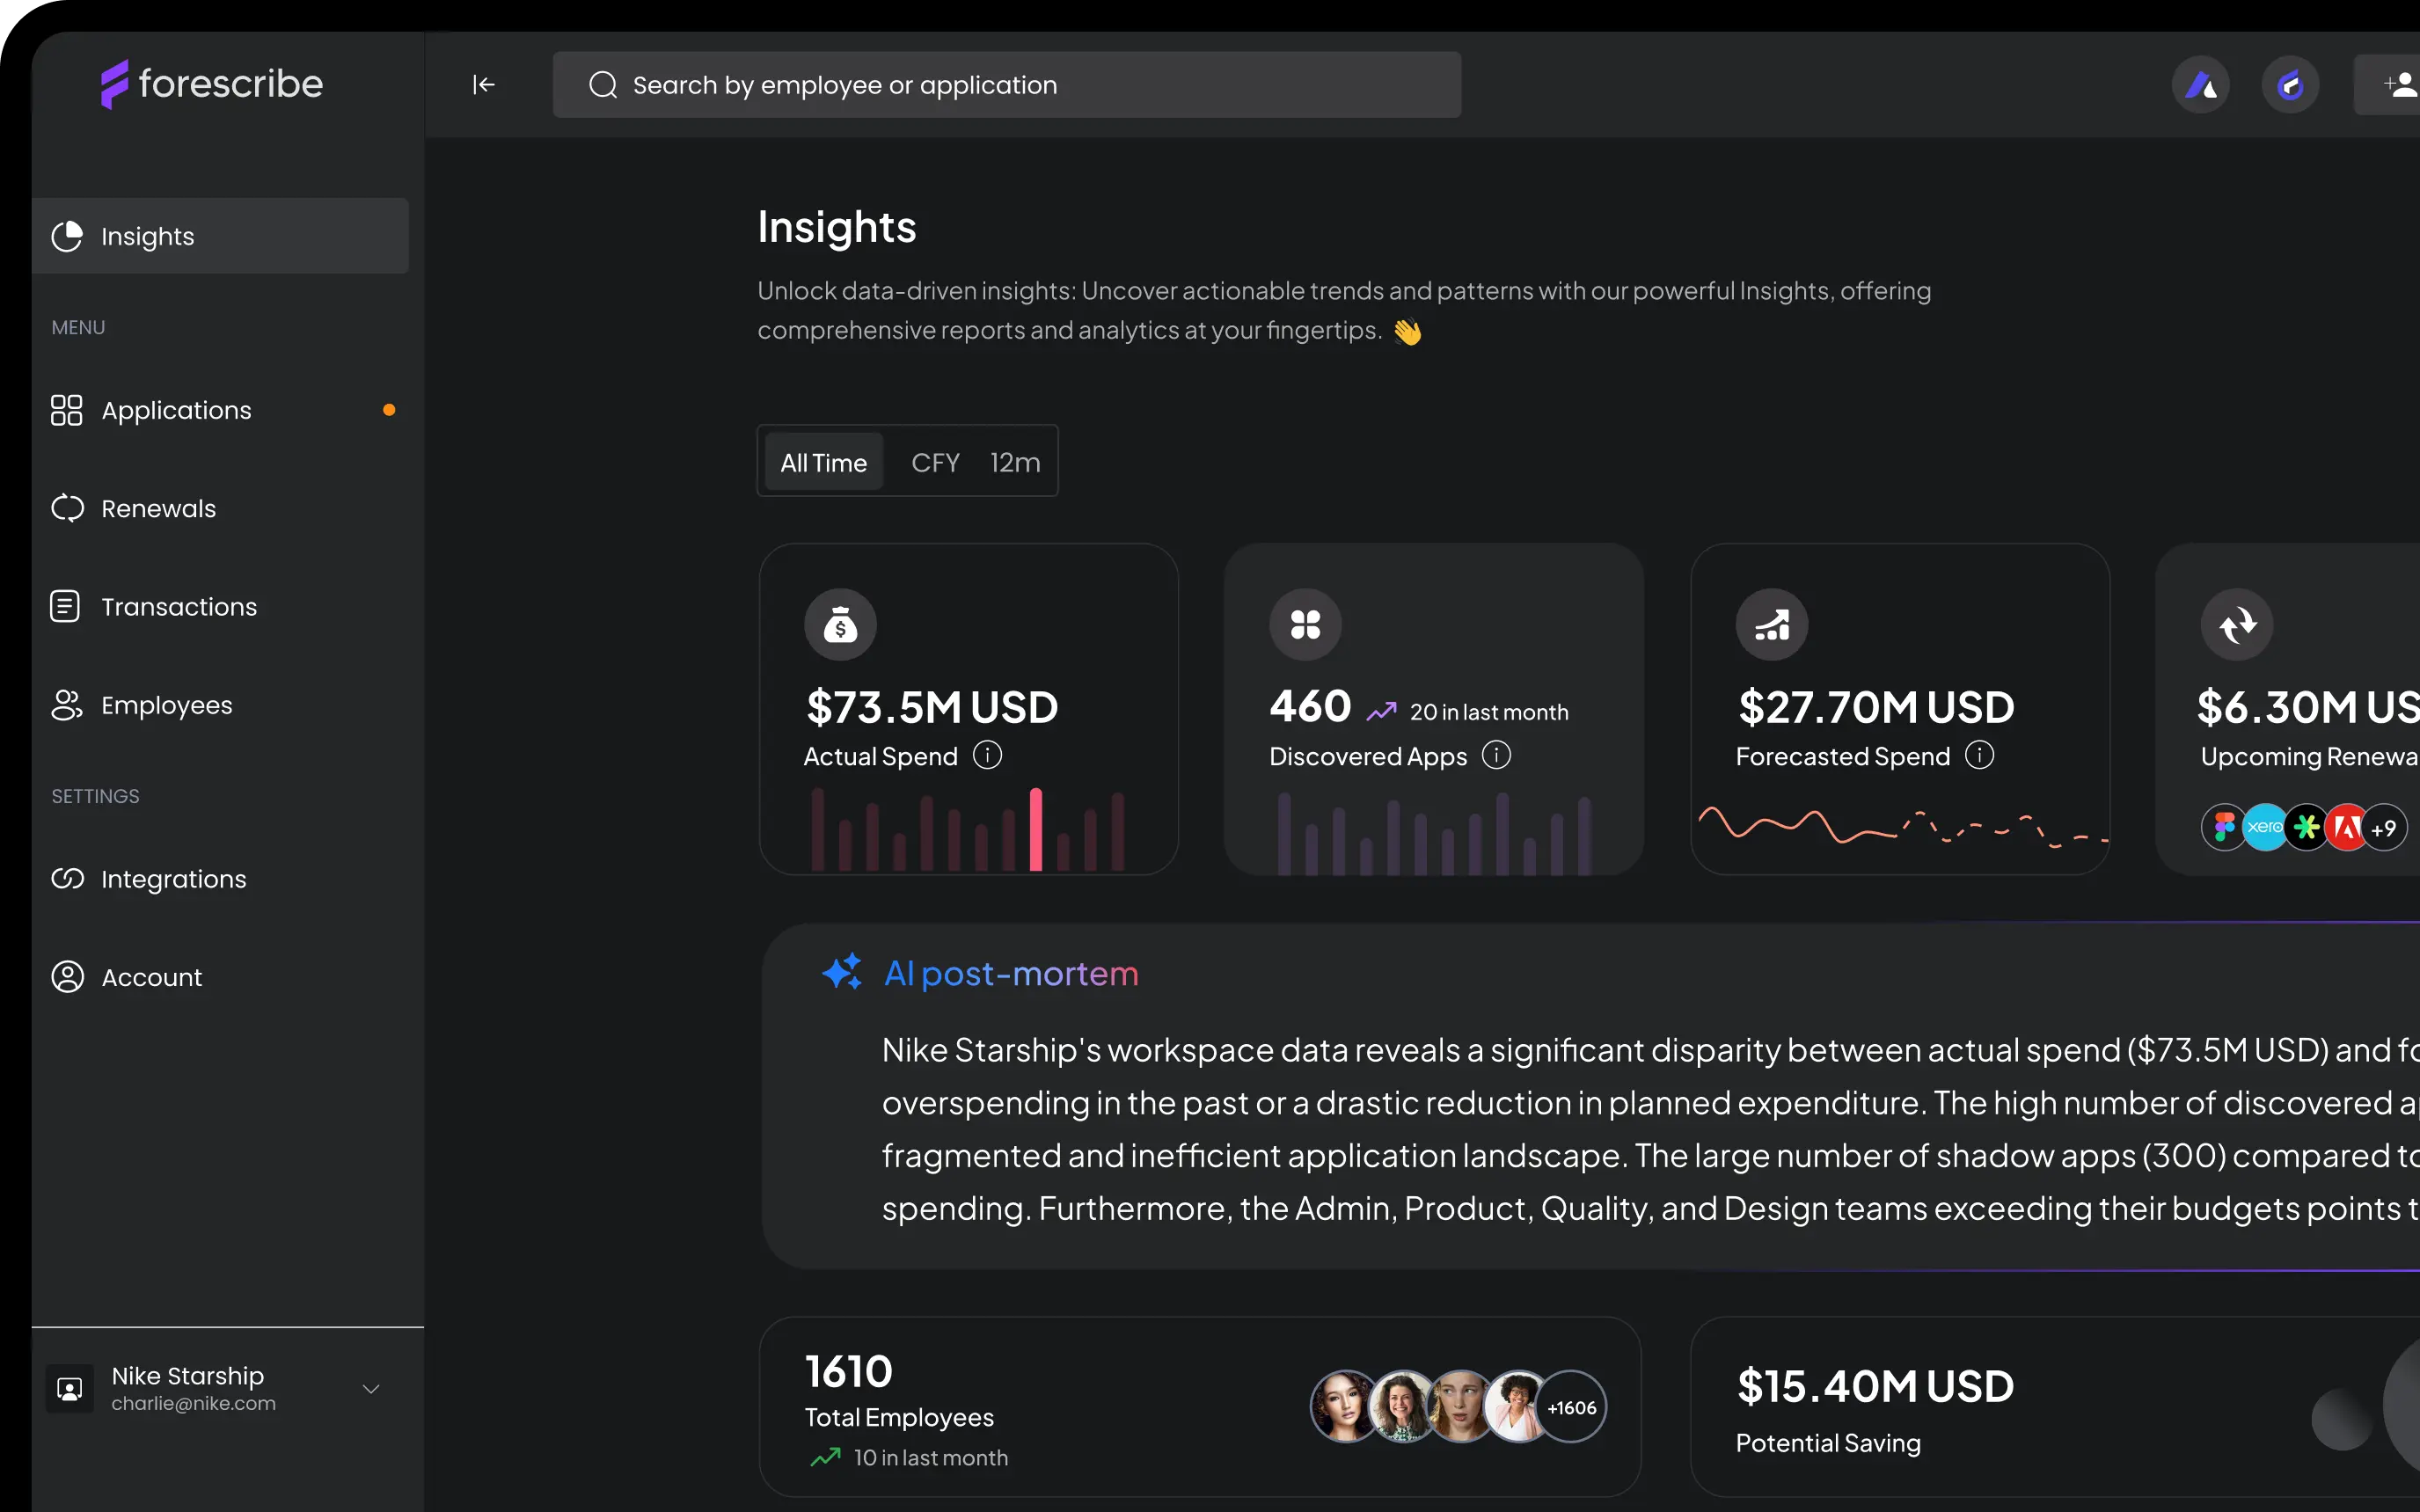
What is Forecasting Deviation Graph?
A visual tool that compares actual spend against forecasted spend over time, highlighting any deviations and helping to pinpoint areas that need attention.
Why it Matters
The forecasting deviation graph provides a visual representation of financial accuracy, helping organizations quickly spot discrepancies and make adjustments to stay on track.
Benefits
- Provides a visual comparison of forecasted vs. actual spend
- Helps identify areas with significant deviations
- Improves forecasting accuracy by highlighting issues early
- Supports more proactive financial management


