What is Data Visualization?
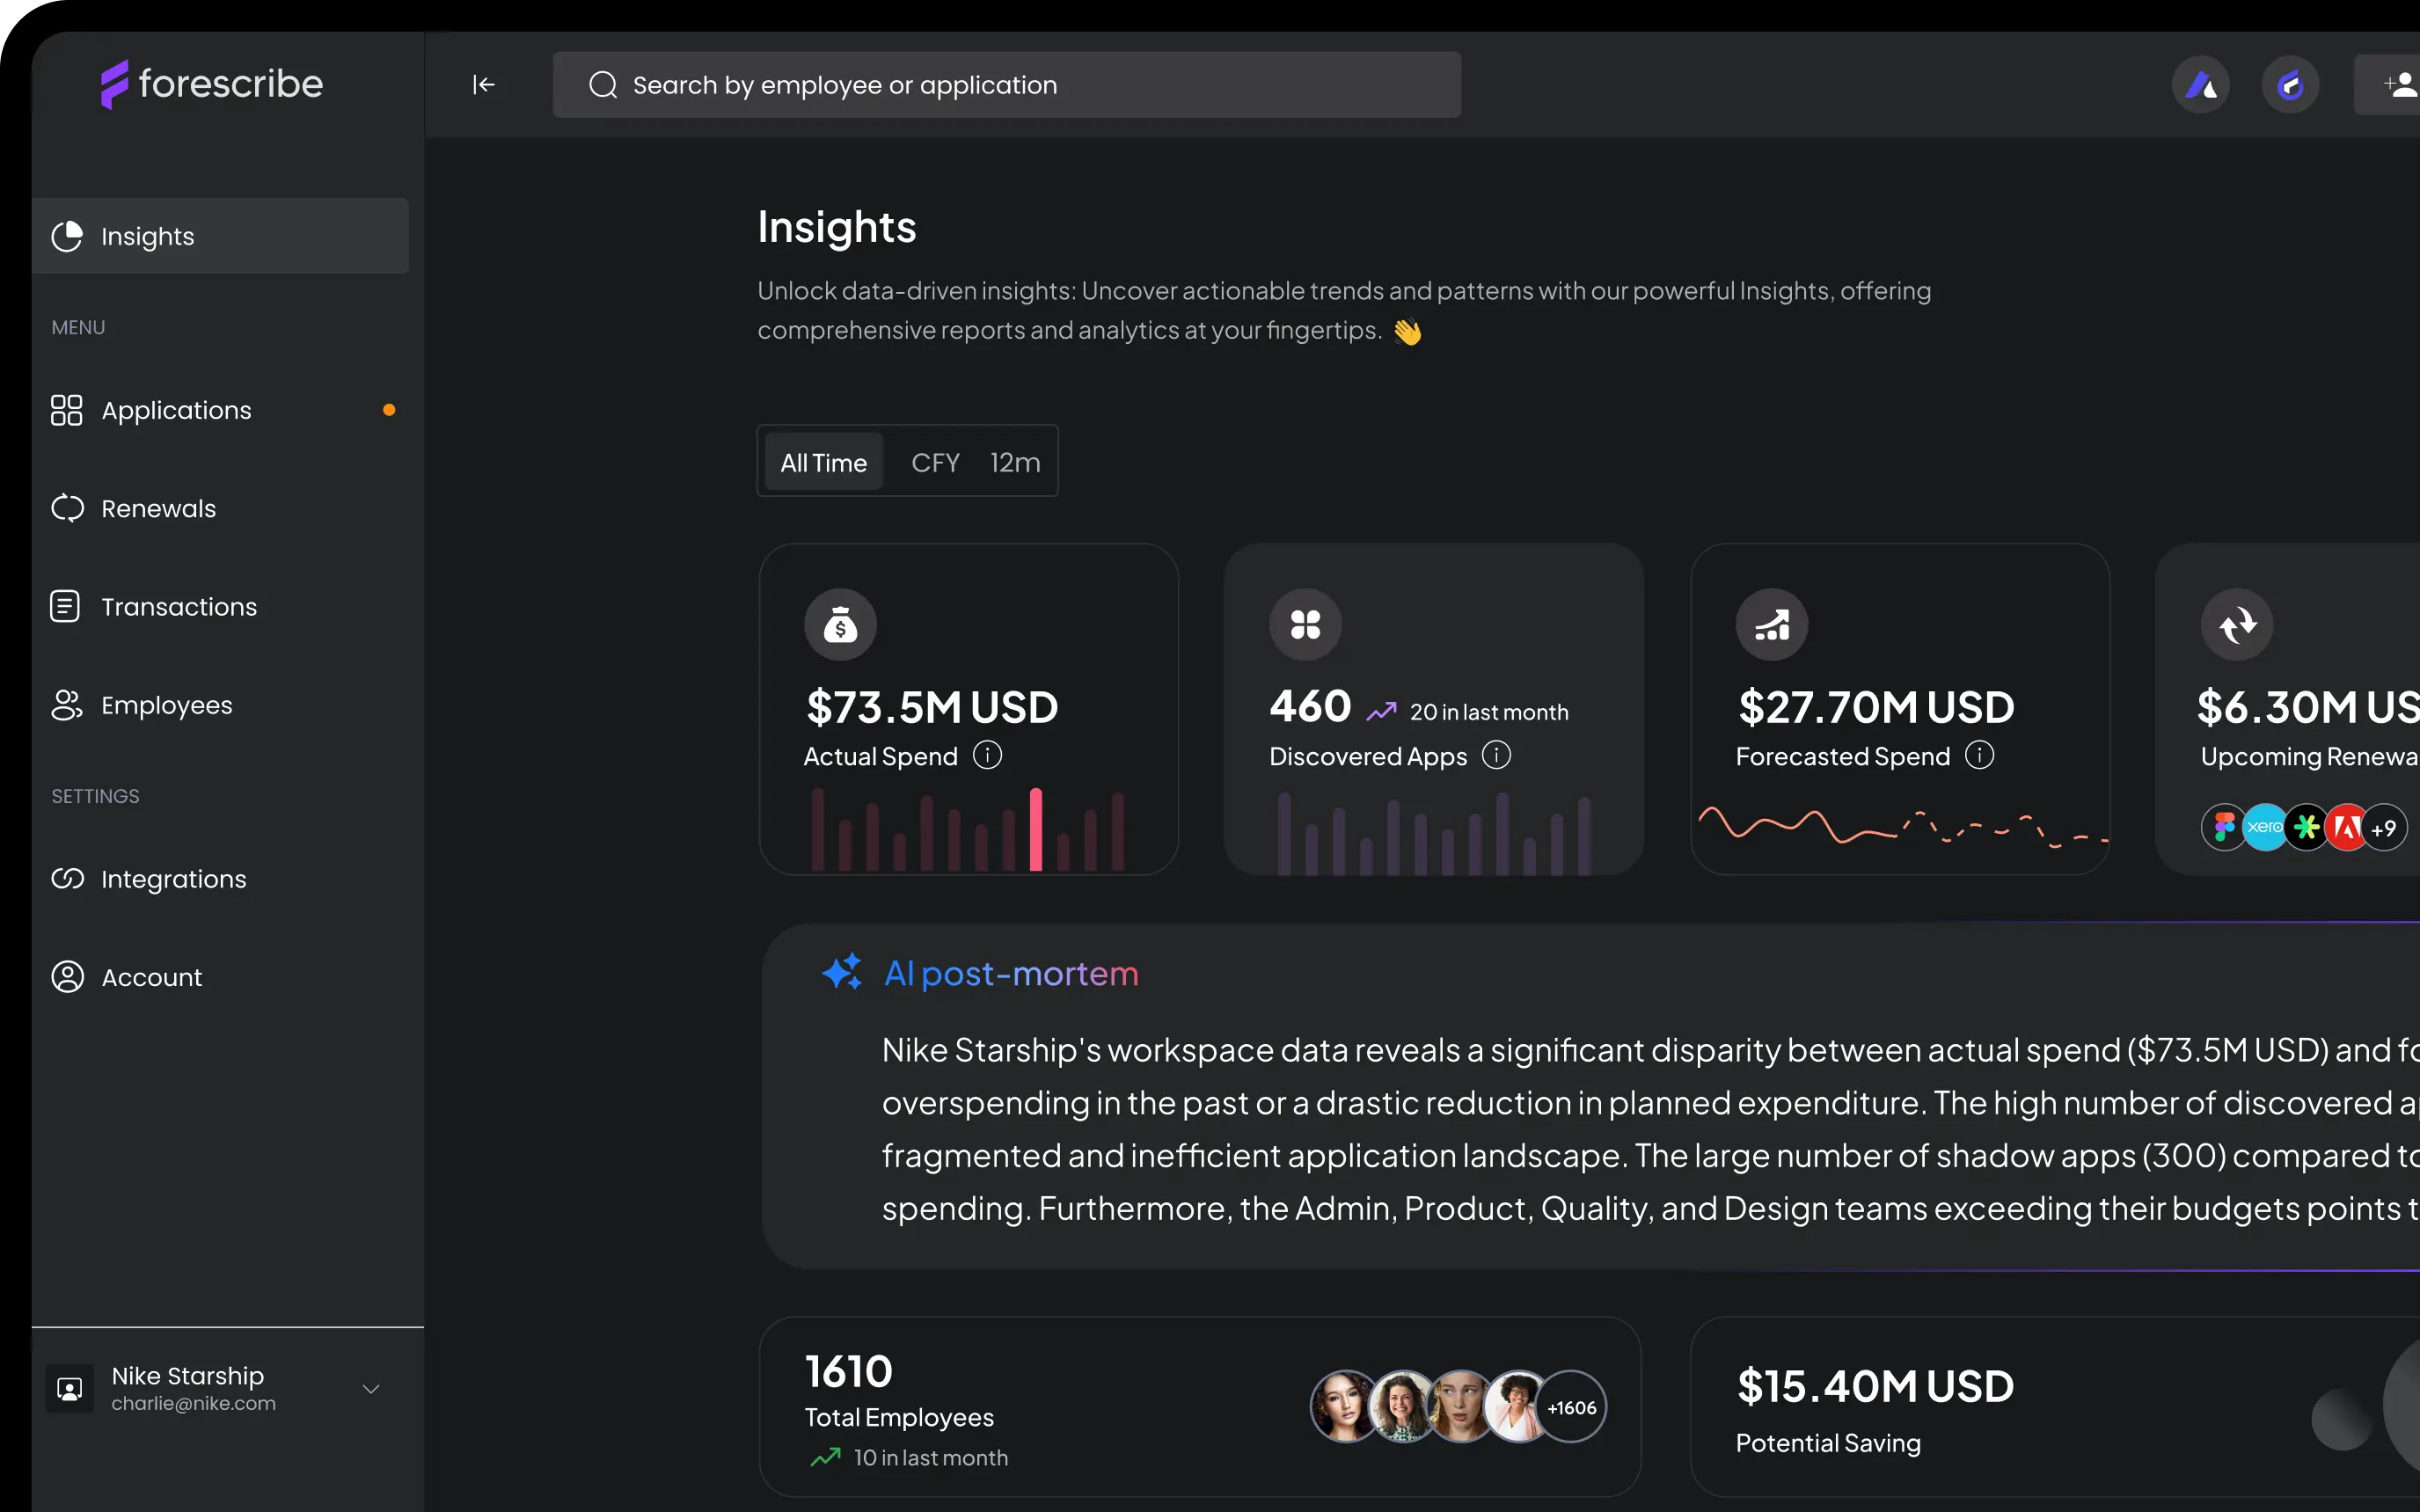
The representation of data in graphical formats like charts, graphs, and dashboards to highlight key metrics such as spend, usage, and performance trends.
Why it Matters
Data visualization simplifies complex data sets, making it easier for teams to understand, interpret, and act on data insights, leading to more informed business decisions.
Benefits
- Simplifies complex data interpretation
- Enhances decision-making with clear, actionable insights
- Facilitates real-time monitoring of key metrics
- Improves communication and collaboration across departments