What is Analytics Dashboard?
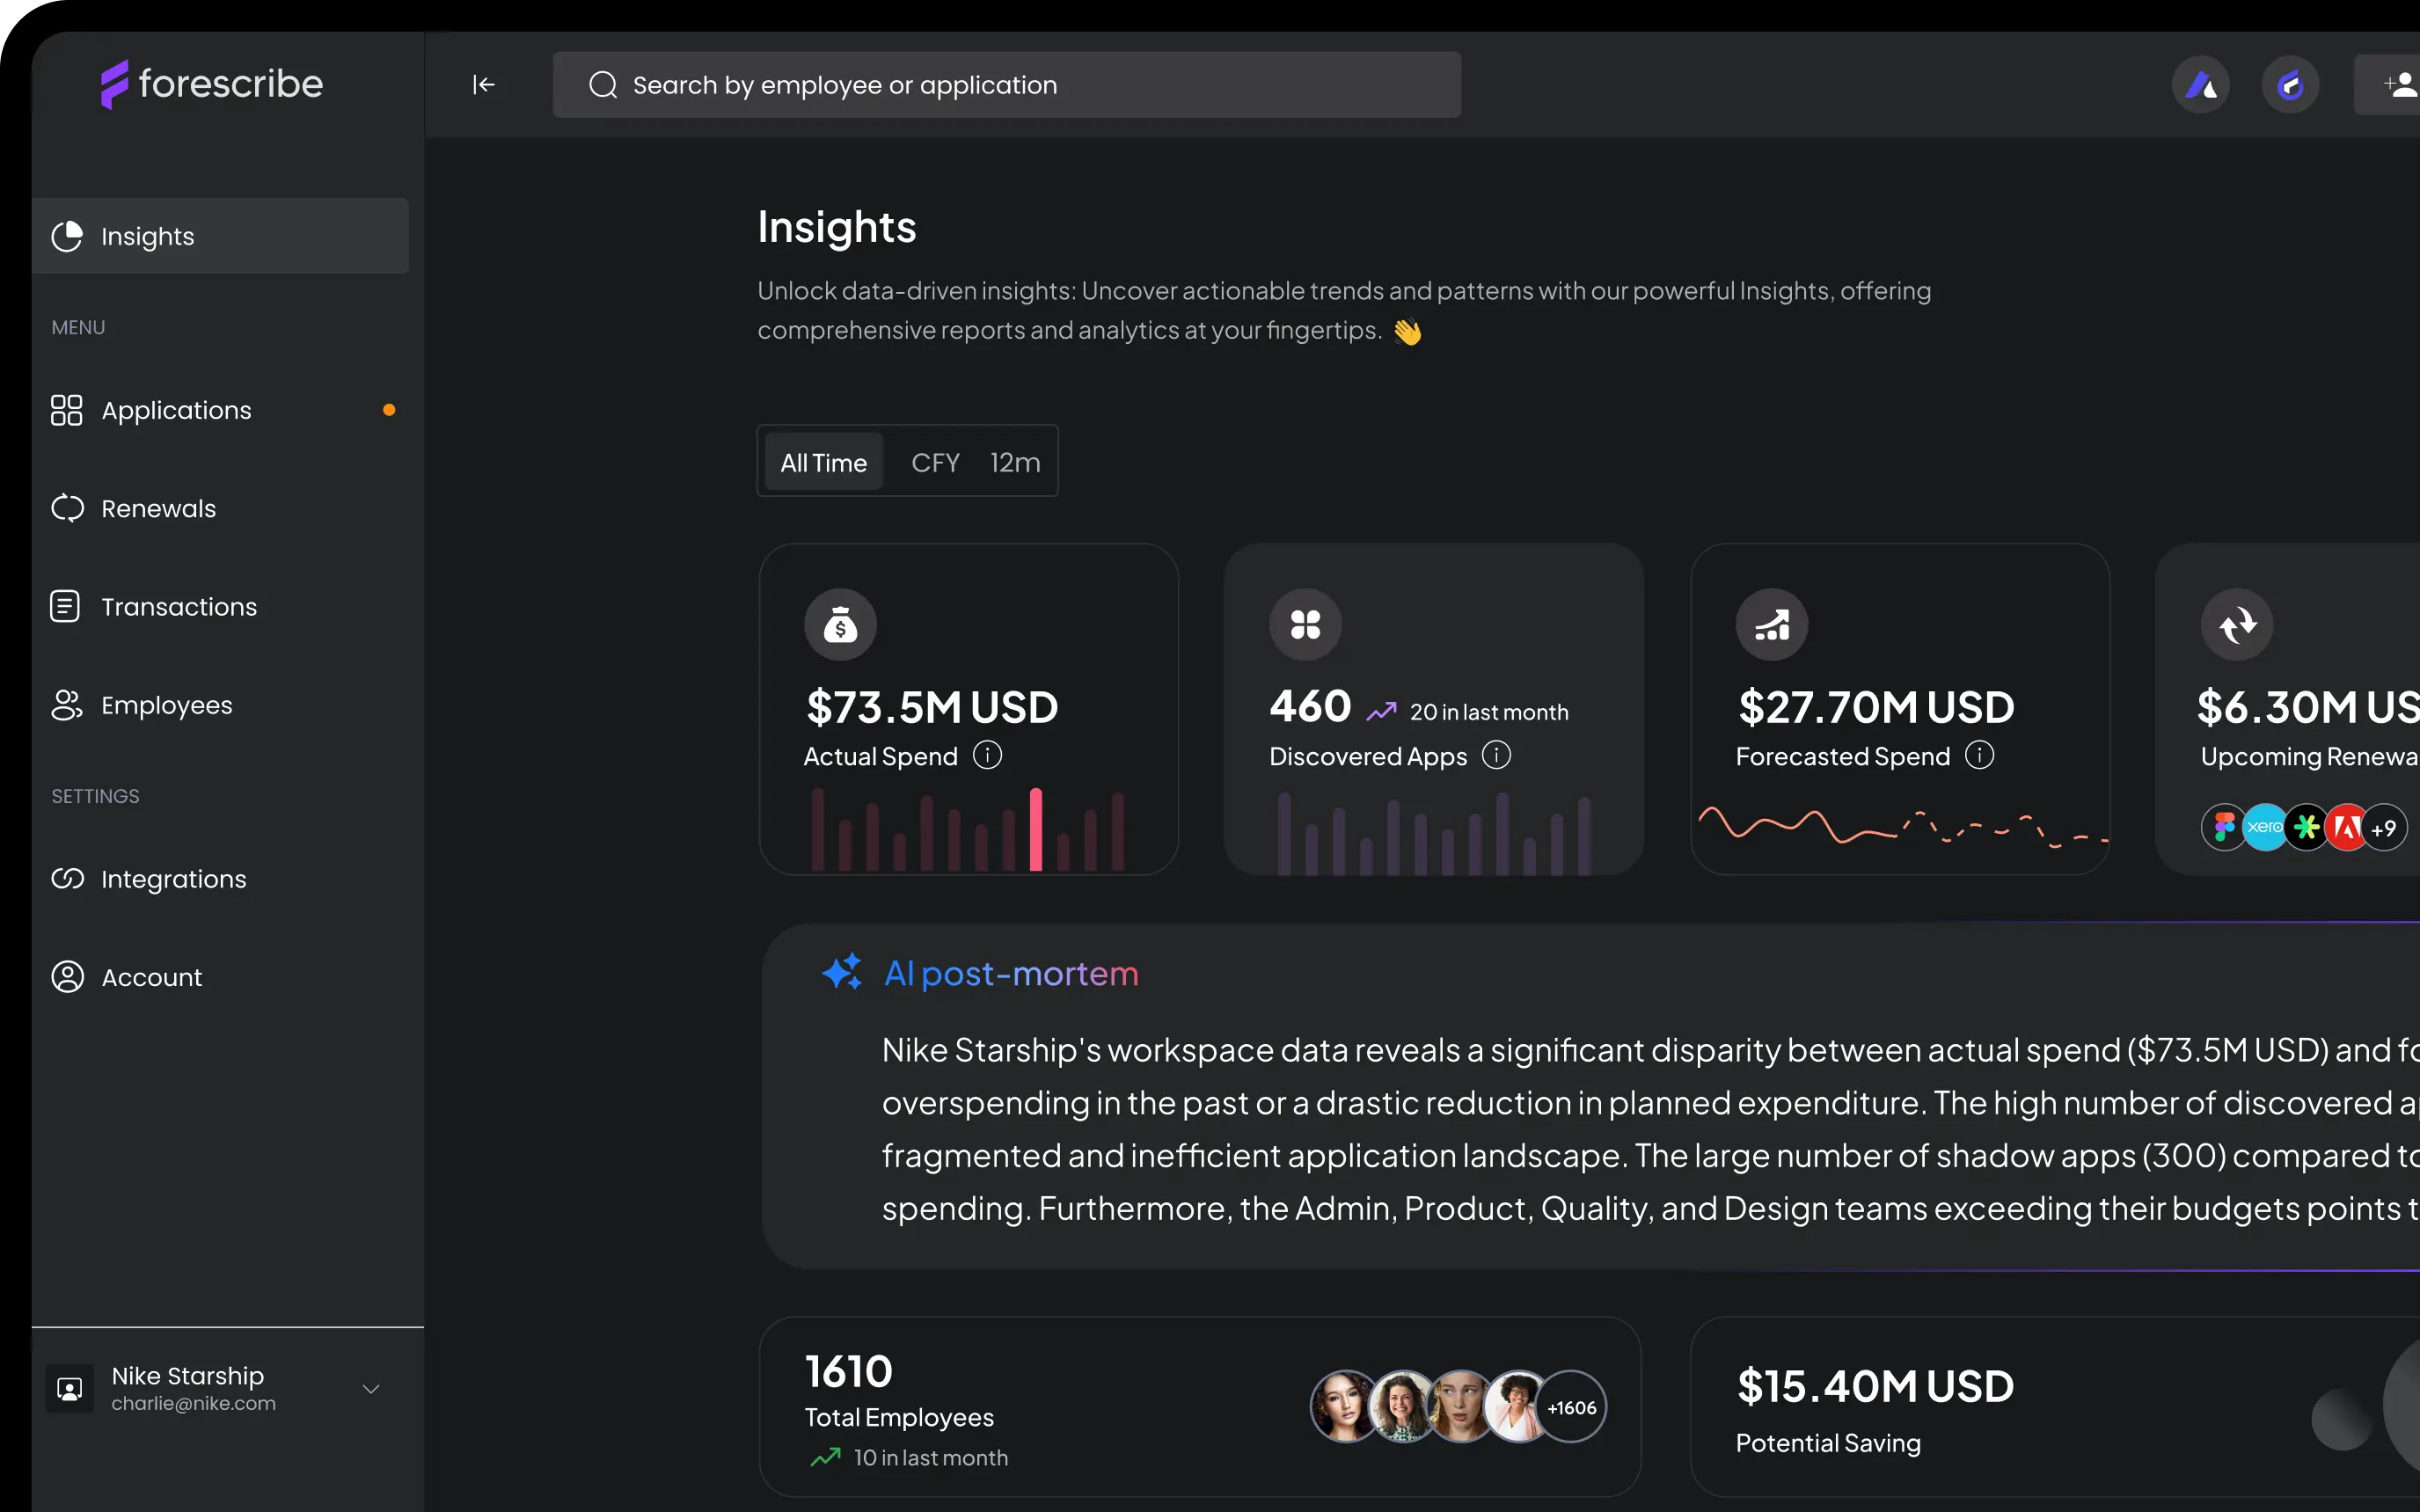
The Analytics Dashboard is a visual tool that provides real–time reports on app usage, costs, and performance. It consolidates data from multiple sources, offering businesses a clear, accessible overview of their software assets, enabling data–driven decision–making for optimizing software portfolio management.
Why it Matters
Analytics dashboards are essential for making informed decisions about software investments. They give businesses an at a glance view of how applications are performing in terms of cost and usage, allowing them to identify trends, detect inefficiencies, and make adjustments in real–time. By consolidating data into one interface, businesses can quickly spot underperforming apps or cost inefficiencies and take action to improve their overall software management.
Benefits
- Visual Reports – Displays app usage and cost in an easily digestible format.
- Real-Time Monitoring – Provides up–to–date insights on app usage.
- Actionable Insights – Helps businesses identify areas for cost savings or efficiency improvements.
- Comprehensive Data – Aggregates and visualizes data from multiple sources for complete overview.